Fundamental Analysis
Updated: April 4, 2019
One of the tools that investors use to manage their portfolios is fundamental analysis. It is helpful in gathering the right
information to make informed investing decisions. Successful fundamental analysis can build a path to meet your goals by allowing
traders to separate companies that are fundamentally strong from those that are fundamentally weak. Fundamental analysis is
different than technical analysis, which focuses more on price moves and technical features of a particular stock's historical performance.
What is Fundamental Analysis?
Fundamental analysis refers to a method of analyzing and evaluating equities, though it may also apply to other types of securities.
With fundamental analysis, income statements, balance sheets, cash flow and other publicly available documents are used to analyze the
financial health of a company. Economic data such as unemployment numbers and interest rates may also be considered. The goal with
fundamental analysis is to find companies that are trading at a discount from their true (or “intrinsic”) value and thus may increase
in share price when the market recognizes their quality.
The Basics of Fundamental Analysis
Many investors believe that fundamental analysis is an important component of almost any trading or
investing strategy.
These are some factors to consider when conducting fundamental analysis:
- What is the company’s revenue?
- Is it growing?
- Are they making a profit?
- Are they increasing indebtedness or paying off debt?
- What are their turnover rates?
- Does management take care of employees?
All of this helps define a numerical intrinsic value for the security that can be compared with its current price
so as to determine whether or not it is overvalued or undervalued.
What is the Difference Between Fundamental Analysis and Technical Analysis?
Fundamental Analysis is often (mistakenly) directly contrasted with Technical Analysis.
Many technical analysts say there is no need to mine corporate and economic data to determine a company’s value, because
everything they need to know is already reflected in the price. Instead, they use a variety of methods to predict where
price will go in the future. They may look at price volatility as measured by the strength and duration of a movement away
from a previous level. They might apply a formula such as MACD, Bollinger Bands, or simply analysis of the moving average
price over time. Trading Academy’s patented Core Strategy is a type of technical analysis that teaches how to identify
supply and demand levels and then predict turning points in the direction of a security or the market as a whole.
Another common misconception is that fundamental and technical analysis are in competition and an investor must make a
choice between them. In fact, when used properly, both can be useful tools for the investor.
How to Use Fundamental Analysis for Trading Stocks
Watch this video to see how smart traders use fundamental analysis when looking at stocks.
Fundamental data: Beta
Price to Earnings in Fundamental Analysis
This measure is a very popular method of fundamental analysis. It consists of finding a company whose
price-earnings (P/E) ratio is low
compared to others of its kind. To find the price-earnings ratio, divide the stock's current price by its earnings per share.

If a stock is selling for $35 now and its earnings last year were $7 a share, the P/E ratio would be 5 (35/7=5). That
means for every $1 the stock earns, investors are currently willing to pay $5. However, investors also pay for future
earnings. If the same $35 stock is expected to earn $9 a share next year, then the P/E ratio would be 3.89 ($35/$9 = 3.89).
The idea is to find stocks with a significantly lower P/E ratio than others in its category. That category could be almost
anything, from an industry group (i.e.; financial stocks) to high-yield securities, or many others.
A refinement of P/E is the PEG ratio. PEG refers to P/E divided by growth rate; if a stock is priced at $80 and has earnings of $5, then it has a 16 P/E ratio.
If that stock has a 20% annual growth rate then its PEG is 0.8. The higher the growth rate the lower the PEG will be, so a stock with a very low PEG has potentially attractive fundamentals.
The following video shows the difference between PE vs PEG:
PE vs PEG
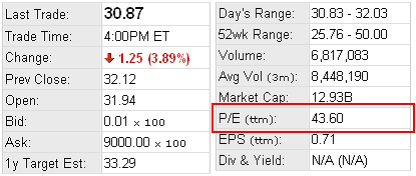
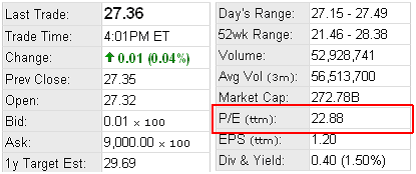
In the following Screens, ABC's P/E Ratio is 43.60 whereas XYZ's P/E Ratio is much lower.
ABC

XYZ

The P/E model is not applicable in all cases. If the company has losses or breaks even, then there are no earnings to compute.
Also, companies in a cyclical industry, or which have a small capitalization, are likely to be less stable which cause their values to fluctuate too much from day to day, week to week or month to month, for P/E values to be a reliable measure.
Highly volatile equities, such as companies focused on new technologies, are a breed apart. Many lose money, so it is impossible to compute a P/E ratio. Yet popular expectations are so high that their prices may be well above profitable companies.
Earnings Per Share in Fundamental Analysis
Earnings per Share (EPS) is calculated by dividing net income by the weighted average common shares outstanding. It is
used in fundamental analysis for valuation purposes. This calculation works well when looking at the past, but if an analyst
wants to look at the future, they need to calculate EPS based on the expected outstanding shares in the future.
At times financial statements will present two types of EPS calculations.: one for primary earnings and the other for fully diluted earnings.
Fully diluted EPS includes all common-stock equivalents, such as warrants and options, and assumes full exercise and conversion. This calculation provides the maximum dilution.
When comparing EPS between companies and within sectors, be sure to use the same EPS calculation, otherwise you will be making comparisons between apples and oranges.
The same is true when calculating the Price/Earnings Ratio (P/E). The P/E includes an EPS number in its calculation. The P/E is one of the most widely used valuation tools for the price of a stock.
Therefore, when doing your own analysis, make sure you are using the same EPS numbers for each company in your P/E calculations.

Cashflow in Fundamental Analysis
Cashflow is an important measure of a business for investors because it is a way of determining a company's ability
to pay dividends and more. Generally, cashflow is defined as the net income (the difference between how much the company
sold and how much it spent during a particular time frame, typically one quarter) of a business, plus depreciation (an
accounting method which spreads out the cost of a fixed asset over several years) plus the value of other non-cash assets
such as intangible assets, including copyright patents, trademarks, licenses, goodwill and franchises.
Companies, like people, need cash to keep going. Corporations need money to pay dividends, of course. But they also need
it to pay for all the goods and services they use, as well as making capital improvements (things you can touch or feel, like
buildings, machinery and computers), and paying operating costs (wages, raw materials, gas for company cars, and electricity).
Companies with a high level of debt have to pay a significant amount in interest to service that debt.
If an opportunity suddenly appears, perhaps to buy a strategically located piece of land or a company that would help the company in some way, cash-poor companies may not have the money to make the deal.
Most important, perhaps, is that during “hard times”, companies with a cash cushion are more likely to survive.
Companies which have cash to make it through the down periods are in a good position to make clear-headed judgments, keep their enterprise afloat and emerge in a stronger competitive position.
One proponent of Cashflow Analysis is Robert L. Renck, Jr., managing director of R.L. Renck & Co., who uses a surplus cashflow
analysis. That approach adds together pretax income (how much money the company takes in before it starts paying taxes) and
depreciation. Then it subtracts capital expenditures, which is the money companies spend to buy or improve capital assets, which again
are those things you can lay your hands on such as computers, machinery or buildings.
Kenneth Hackel, founder of Systematic Financial Management, New Jersey, scours stocks for companies that can pay off their entire
debt entirely from free cashflow. That figure is arrived at by taking, for the current year, the amount of cash left over after
taxes, then adding the sum of all the fixed assets - the company's property used in running the business but which won't be sold
off, such as furniture, machinery, computers - which have depreciated for that year, plus other non-cash expenses such as amortization
and depreciation. Then subtract all capital expenditures and any increase in working capital, which is the money left over,
by subtracting the liabilities from the assets.
As you begin to develop a picture of what you want in a stock, information obtained from technical and fundamental analysis could be
used as benchmarks to measure the worth of potential investments. Since the most popular fundamental analysis focus on specific company's
earnings, growth and value in the market, consider the market evaluation of the entire sector and overall market conditions rather than
just that of the individual stock. Performance of one company is generally greatly influenced by the sector and overall market conditions.
Get Started with Your Financial Education
This content is intended to provide educational information only. This information should not be construed
as individual or customized legal, tax, financial or investment services. As each individual's situation
is unique, a qualified professional should be consulted before making legal, tax, financial and investment
decisions.
The educational information provided in this article does not comprise any course or a part of any course
that may be used as an educational credit for any certification purpose and will not prepare any User
to be accredited for any licenses in any industry and will not prepare any User to get a job. Past
results are not a guaranty of future performance.