Most beginners assume that reading a stock chart requires advanced math or years of experience. That is a myth. A stock chart is simply a visual record of how buyers and sellers have interacted over time, and learning to read one is a foundational skill that any motivated student can develop with structured instruction and consistent practice.
If you have ever looked at a chart and felt overwhelmed by the lines, bars, and numbers on your screen, you are not alone. Nearly every successful trader started in the same place. The difference between the traders who quit and the ones who improve is not talent. It is structure. Once you understand what each element represents and how to interpret the story the chart tells, the screen stops looking random and starts revealing useful information.
What You’ll Discover in this article
- How stock charts display price history and why that matters for your trading decisions
- The difference between candlestick, bar, and line charts and when to use each
- How to identify supply and demand zones on a chart and what they signal about potential price movement
- Key volume and timeframe concepts that add context to price action
- Why risk management belongs in every chart-reading decision you make
What Is a Stock Chart and Why Does It Matter?
A stock chart is a graphical representation of a security’s price over a defined period. It plots price on the vertical axis and time on the horizontal axis, creating a visual timeline of how a stock’s value has changed. Whether you are looking at five minutes of trading or five years, the chart tells you one thing: what happened between buyers and sellers during that window.
This matters because markets are driven by human behavior, and human behavior tends to repeat. When you study a chart, you are studying the collective decisions of thousands of participants. Those decisions create patterns, and those patterns often recur in recognizable ways.
In Trading Academy training centers, we teach students that price is ultimately determined by the relationship between supply and demand. When demand exceeds supply, prices tend to rise. When supply exceeds demand, prices tend to fall. A stock chart lets you see where those imbalances have occurred in the past, which can help you identify where they may occur again. Trading involves substantial risk of loss, and no chart pattern can predict the future with certainty, but understanding price history gives you a structured framework for more informed decisions.
Types of Stock Charts: Line, Bar, and Candlestick
Not all stock charts display information the same way. The three most common types are line charts, bar charts, and candlestick charts. Each shows price data, but the level of detail varies.
Line Charts
A line chart is the simplest format. It connects closing prices over time with a single line, giving you a clean view of the overall trend. Line charts are useful for a quick snapshot of direction, but they leave out details like intraday price ranges and opening prices.
Bar Charts
A bar chart adds more information. Each vertical bar represents a single time period (one day, one hour, one five-minute interval) and shows four data points: the open, the high, the low, and the close (often abbreviated as OHLC). Small horizontal ticks on the left and right of each bar indicate the opening and closing prices.
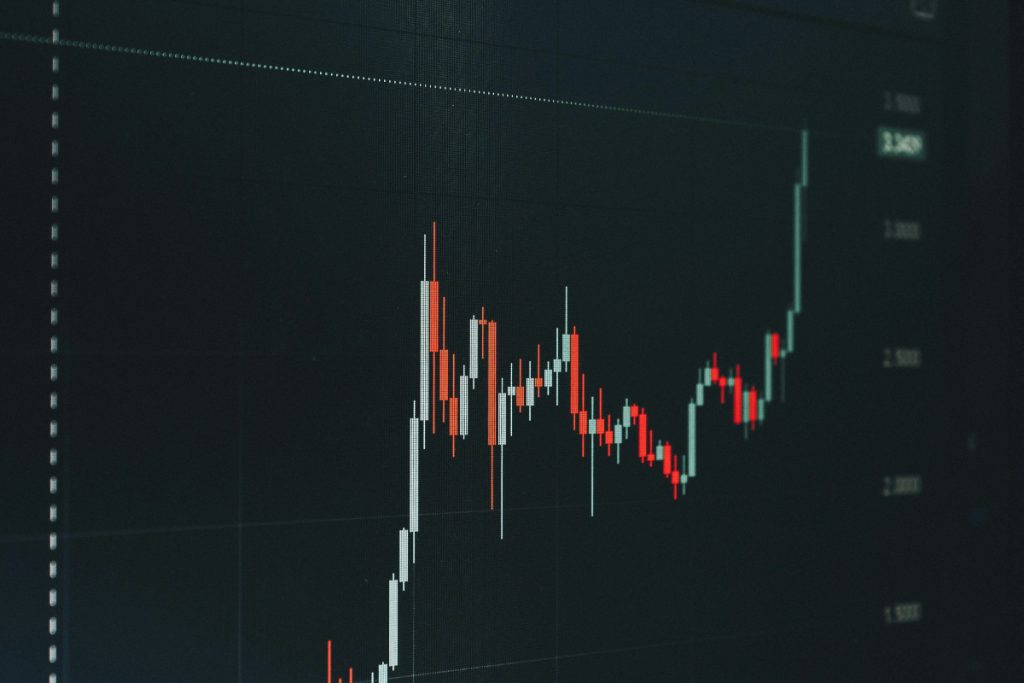
Candlestick Charts
Candlestick charts display the same OHLC data as bar charts but in a more visually intuitive format. Each “candle” has a body (the area between the open and close) and wicks, also called shadows, that extend to the high and low. If the close is higher than the open, the body is typically colored green or white. If the close is lower, the body is red or black. This color coding makes it faster to scan a chart and assess whether buyers or sellers controlled each period.
Most Trading Academy students learn on candlestick charts because of their clarity and the analytical tradition behind them. Candlestick patterns have been studied for centuries, originating with Japanese rice traders in the 1700s [1].
**Trading Tip:** When you are starting out, set your charting platform to candlestick view and spend time simply watching how candles form in real time on a demo account. You do not need to memorize dozens of patterns right away. Focus first on understanding what the body and wicks tell you about buyer and seller activity within each time period.
How to Read Price Action on a Chart
Price action refers to the movement of a security’s price over time, stripped of indicators and overlays. It is the raw data of the market and the basis of how Trading Academy teaches chart reading.
When you look at a candlestick chart, you are seeing the result of every buy and sell order executed during that period. A long green candle with short wicks tells you buyers controlled the session and pushed prices steadily higher. A candle with a small body and a long upper wick suggests buyers tried to push prices up but sellers drove the price back down before the close.
Reading price action means learning to interpret these dynamics candle by candle and across sequences of candles. Here are three foundational concepts:
Trend identification. Is the price making higher highs and higher lows (uptrend), lower highs and lower lows (downtrend), or moving sideways within a range? Identifying the trend is the first step in understanding what the chart is telling you.
Momentum shifts. Watch for candles that change character. If you see a series of small-bodied candles followed by a large-bodied candle in the opposite direction, that may signal a shift in who is controlling the price, buyers or sellers.
Consolidation zones. Periods where price moves sideways in a tight range often precede significant moves. These consolidation areas frequently correspond to supply and demand zones, which we will discuss next.
Understanding Supply and Demand Zones
At Trading Academy, we teach that supply and demand is the foundational principle behind all price movement. Rather than relying on traditional technical indicators that lag behind price, we focus on identifying zones where supply and demand are out of balance, because that is where price is most likely to move.
A demand zone is a price area where buying interest has historically been strong enough to push price higher. On a chart, demand zones often appear where price dropped to a level, paused, and then rallied sharply. The rally suggests that buyers overwhelmed sellers at that price.
A supply zone is the opposite: a price area where selling pressure has historically overwhelmed buying interest. Supply zones often appear where price rose to a level, stalled, and then declined sharply.
When price returns to a previously identified demand zone, a trader studying supply and demand would watch for signs that buyers are stepping in again. When price approaches a supply zone, the expectation shifts toward potential selling pressure. These are not certainties. Past performance does not guarantee future results. But supply and demand zones give you a structured, rules-based framework for interpreting what the chart may be telling you.
The Role of Volume and Timeframes
Price tells you what happened. Volume tells you how many participants were involved. Together, they give you a more complete picture.
Volume is the total number of shares or contracts traded during a given period. On most charts, volume appears as a histogram at the bottom of the screen.
High volume on a price move suggests conviction. If a stock breaks out of a consolidation zone on heavy volume, it signals strong participation, which can indicate that the move has staying power. Low volume suggests less conviction. According to the SEC, volume data is a standard component of market transparency and is available to all participants through public exchange feeds [2].
Timeframes add another dimension. The same stock will look different on a five-minute chart than on a daily or weekly chart. Short timeframes show intraday activity and are used by day traders. Longer timeframes reveal broader trends and are more relevant for swing traders and investors.
One common mistake beginners make is looking at only one timeframe. Trading Academy instructors teach students to use multiple timeframes together. You might use a daily chart to identify the overall trend and a supply or demand zone, then drop to a shorter timeframe to fine-tune your entry. This approach helps you align short-term decisions with the bigger picture.
Putting It All Together: Reading a Chart Step by Step
Let’s walk through a structured process for reading any stock chart. This is the kind of step-by-step approach that Trading Academy students practice in our education centers.
Step 1: Identify the trend. Zoom out to a daily or weekly chart. Is the stock in an uptrend, downtrend, or range? The larger context prevents you from fighting the dominant direction.
Step 2: Mark supply and demand zones. Look for areas where price made a strong move away from a level. Mark them as horizontal areas on your chart (zones, not single lines, because these are areas, not exact prices).
Step 3: Check volume. Did the strong moves away from your zones occur on high volume? Higher volume adds confidence that the zone is significant.
Step 4: Choose your timeframe. Decide whether you are looking for an intraday opportunity or a multi-day move, and select the appropriate chart timeframe.
Step 5: Wait for price to return to a zone. Rather than chasing price, you wait for it to come back to an area where you have identified a supply or demand imbalance.
Step 6: Assess the risk. Before entering any position, define your stop loss and your risk-reward ratio. A common guideline is to look for setups where the potential reward is at least two to three times the risk. Only trade with capital you can afford to lose.
Step 7: Document and review. Write down what you see, what decision you made, and what happened. This trading journal becomes your most valuable learning tool over time.
Common Chart-Reading Mistakes Beginners Make
Even with good instruction, beginners often fall into predictable traps. Recognizing these early saves time and frustration.
Overloading indicators. Adding too many oscillators and overlays to your chart creates noise. Start with clean price action and add tools sparingly as your skill develops.
Ignoring the larger timeframe. A bullish pattern on a five-minute chart means less if the daily chart shows a clear downtrend. Always check the bigger picture first.
Skipping risk management. Reading a chart is only part of the process. Every trade decision should include a predefined stop loss and a clear risk-reward calculation. Without these, even a correct chart read can result in losses that exceed what you intended to risk.
Confusing correlation with causation. A pattern that appeared before a price move in the past does not mean it will cause the same move again. Charts show probabilities, not guarantees.
Frequently Asked Questions
How Long Does It Take to Learn to Read Stock Charts?
Most students begin to feel comfortable with basic chart reading within a few weeks of consistent practice. Developing the skill to read charts confidently in live market conditions takes longer, often several months of structured study. Like any skill, chart reading improves with repetition. Trading Academy offers hands-on instruction where students practice with experienced instructors providing real-time feedback.
Do I Need Expensive Software to Read Stock Charts?
No. Many free and low-cost charting platforms provide candlestick charts with volume data and drawing tools. What matters more than the platform is your understanding of what the chart is showing you. Focus your investment on education first, and let the tools support what you have learned.
Can Stock Charts Predict the Future?
No chart can predict future price movements with certainty. What charts can do is show you where supply and demand imbalances have occurred historically and help you identify areas where similar dynamics may develop again. This is a probabilistic framework, not a crystal ball. Trading involves substantial risk of loss, and every trading decision should include a risk management plan that accounts for the possibility of being wrong.
__________________________________________________
Ready to develop your chart-reading skills with expert guidance?
Get Started with Your Financial Education
__________________________________________________
Sources
[1] Nison, S. (1991). Japanese Candlestick Charting Techniques. New York Institute of Finance. Candlestick charting originated with Japanese rice merchant Munehisa Homma in the 18th century.
[2] U.S. Securities and Exchange Commission. “Market Structure Data and Analysis.” SEC.gov. Volume data is publicly available through consolidated exchange feeds under Regulation NMS.
__________________________________________________
This content is intended to provide educational information only. This information should not be construed as individual or customized legal, tax, financial or investment services. As each individual’s situation is unique, a qualified professional should be consulted before making legal, tax, financial and investment decisions.
The educational information provided in this article does not comprise any course or a part of any course that may be used as an educational credit for any certification purpose and will not prepare any User to be accredited for any licenses in any industry and will not prepare any User to get a job. Past results are not a guaranty of future performance.